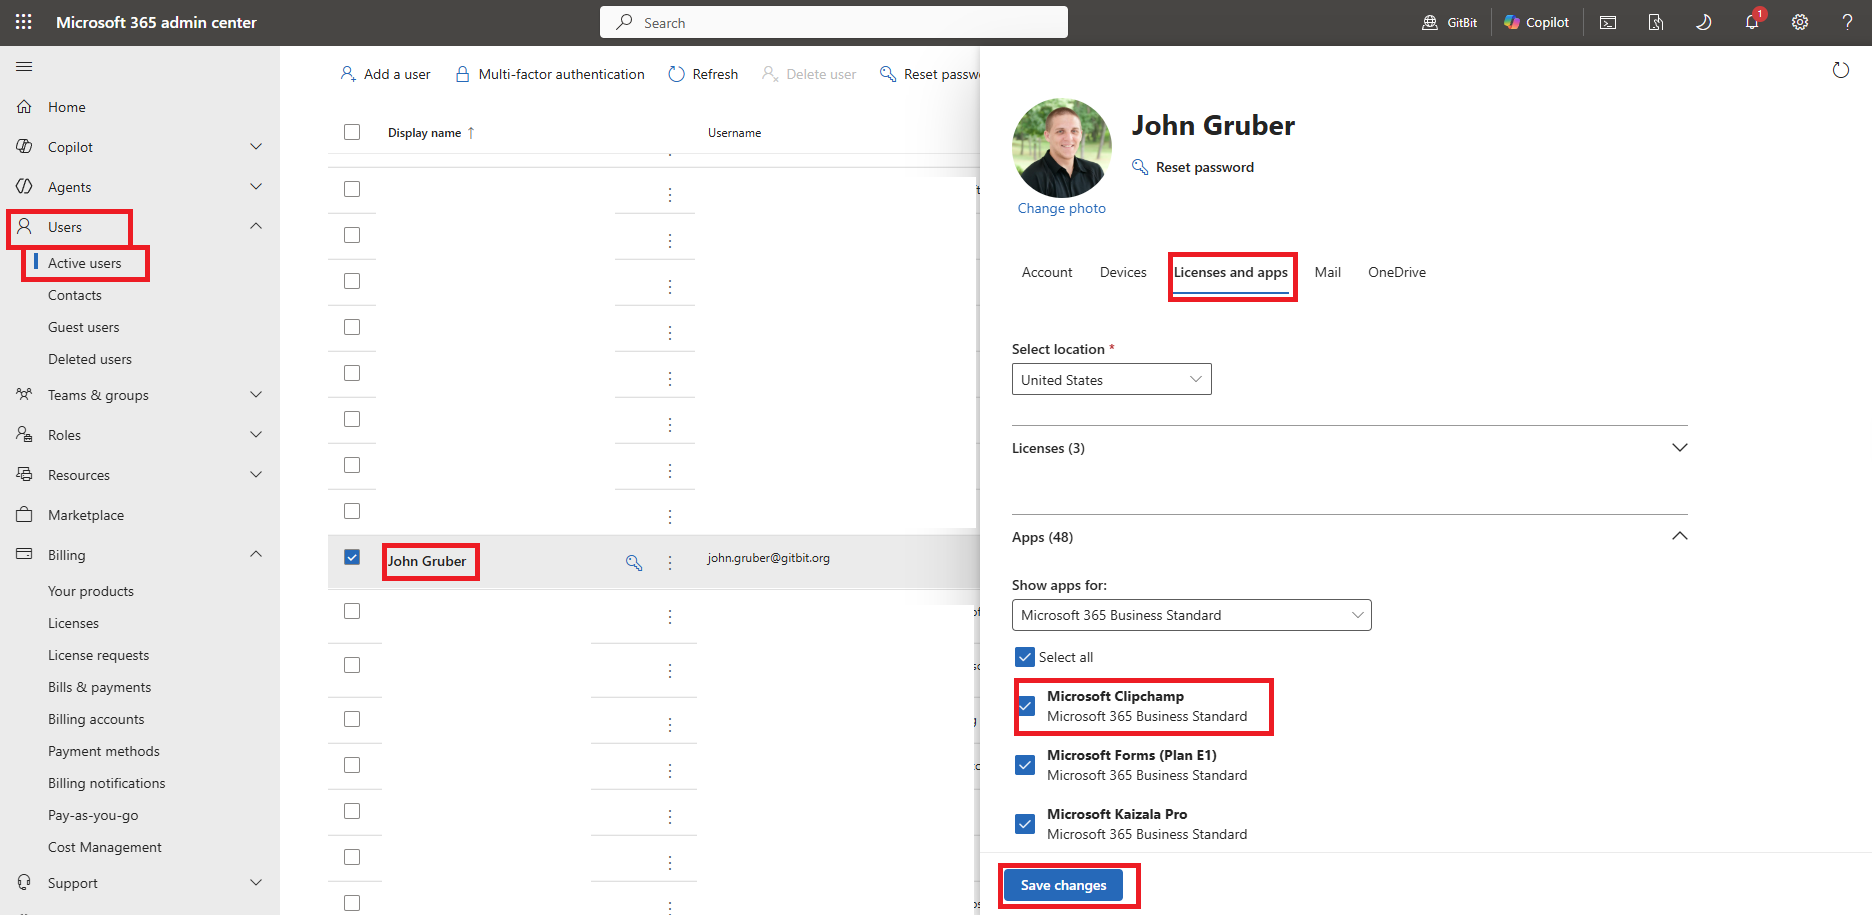
Microsoft 365 License Optimization: Why 22% of M365 Spend is Wasted (2026)

Executive Summary: The State of M365 Over-Licensing
Key Takeaway:
- The Average Waste: 22% of enterprise Microsoft 365 expenditure is lost to structural underutilization.
Top 3 Drivers:
- Disabled & Inactive Accounts: Inactive users (30+ days) retaining active licenses.
- Shelfware: Unassigned license inventory sitting idle in tenant pools.
- Tier-Overlicensing: Users assigned high-tier licenses who only utilize basic features. Example: Assigned Microsoft 365 E3, while only needed Exchange Online Plan 2.
Potential Savings:
- An estimated $858,000/month per 100k seat tenant via automated lifecycle de-provisioning.
- An estimated $43,000/month per 1,000 seats recovered via automated lifecycle de-provisioning.
In modern enterprise frameworks, Software-as-a-Service (SaaS) environments account for a significant share of predictable operating expenses. Among these, the Microsoft 365 (M365) ecosystem stands as a foundational utility for corporate collaboration, communication, and security architectures. However, the inherent complexity of M365 licensing structures, characterized by tiered packages, multi-tenant distributions, and frequent add-on iterations, frequently introduces significant operational opacity.
To quantify the efficiency of our current deployment, a comprehensive financial and technical audit was conducted across our Microsoft 365 tenant environments, encompassing 118,841 active and provisioned user accounts.
Core Finding: The 22% Efficiency Gap
The primary directive of this audit was to identify discrepancies between contracted licensing expenditure and actual user utilization. The investigation revealed a critical systemic vulnerability in our cloud spend management: 22% of total Microsoft 365 expenditure is currently lost to cloud waste and structural underutilization.
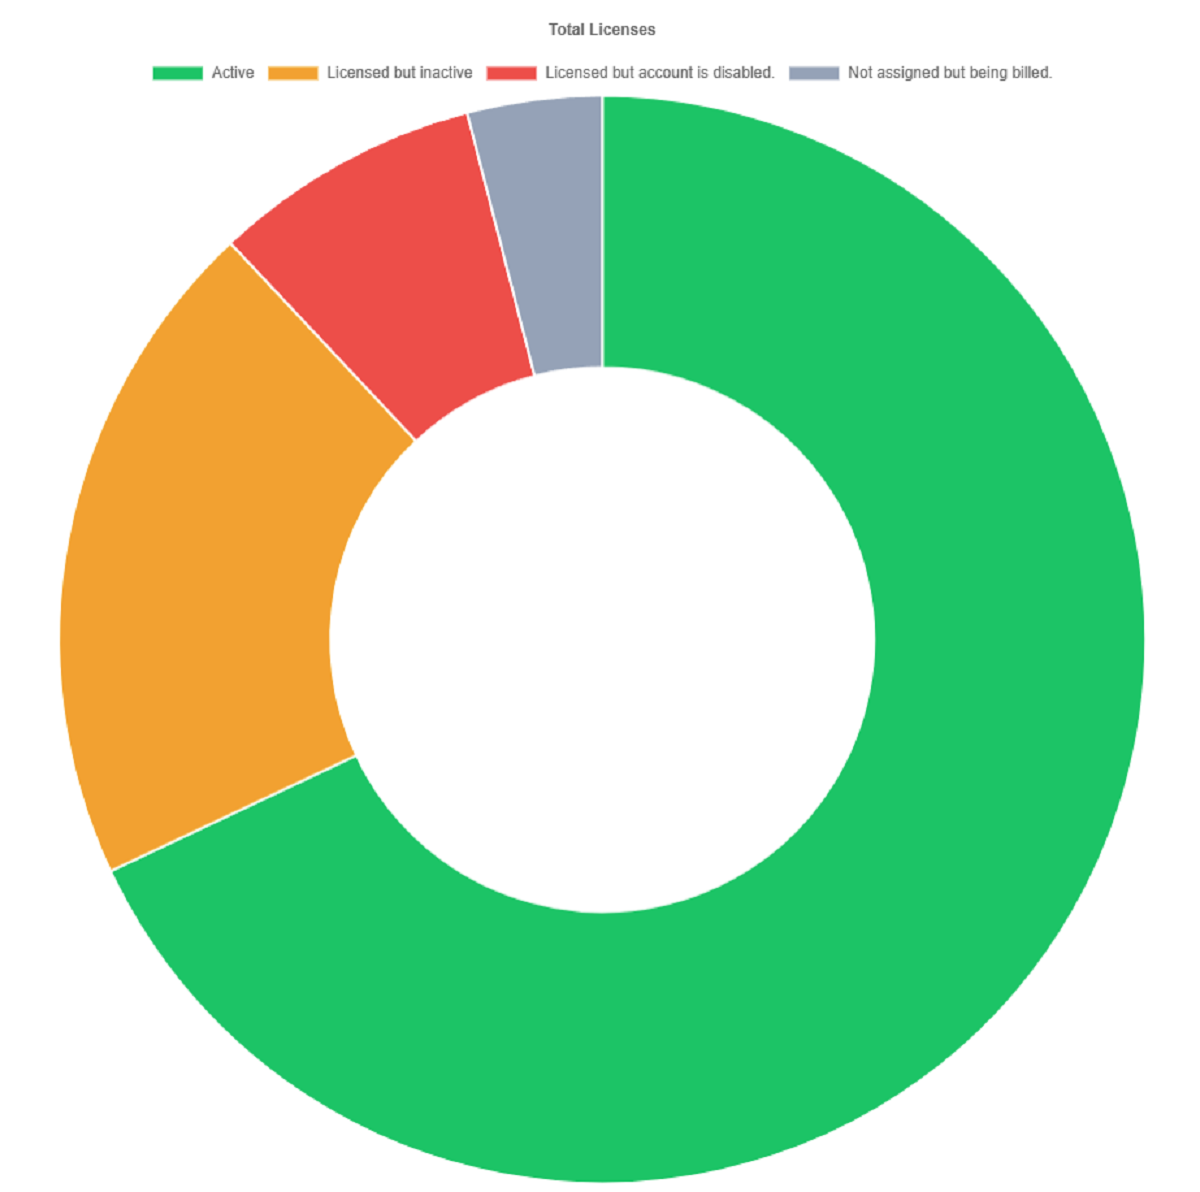
Unlike infrastructure-as-a-service (IaaS) waste, which is typically driven by idle computing runtime, this 22% capital leak is entirely structural. It represents a persistent, monthly recurring cost that delivers zero operational value to the organization. Left unaddressed, this efficiency gap represents an unnecessary inflation of our IT operating budget by an estimated $156,000 annually.
Primary Drivers of Capital Leakage
The audited waste margin is not a product of a single administrative failure, but rather a compounding effect across three distinct vectors of license mismanagement:
Orphaned and Inactive Identities: Premium, high-tier licenses remain provisioned to departed personnel, service accounts, or disabled identities. These accounts continue to incur monthly charges despite showing zero interactive utilization for over 30 days.
Tier-Inflation (Over-Licensing): A significant subset of the workforce is currently provisioned with top-tier Microsoft 365 E5 licenses, yet their documented application usage patterns indicate they only require the core productivity applications provided by lower-tier Exchange Online Plan 2 allocations.
Unassigned Inventory (Shelfware): Excess license capacity purchased during prior renewal cycles or scaling phases remains unallocated in the tenant pool, acting as idle capital that does not align with current headcounts.
Security and Governance Implications
Beyond the immediate financial penalties, this 22% optimization gap poses an acute governance risk. Unmanaged, orphaned accounts with active, high-privilege licenses expand the corporate digital attack surface. These identities often bypass strict lifecycle management policies, turning financial waste into potential entry points for credential stuffing, data exfiltration, and unauthorized tenant access.
Strategic Recommendation
Remediating this 22% efficiency gap does not require sacrificing operational velocity or worker productivity. By executing a structured, automated de-provisioning and tier-downgrade roadmap, the organization can fully recover this lost budget within the current fiscal year. Transitioning from a reactive procurement model to a continuous, proactive M365 spend management framework will permanently protect the organization against future license creep.
Methodology
To establish an accurate, empirical baseline for Microsoft 365 expenditure efficiency, this audit isolated specific, provable vectors of capital leakage within the tenant environment. Data collection was restricted to native license state metrics and active user interaction logs over a trailing 30-day period.
To ensure the statistical integrity of the final 22% waste metric, the methodology explicitly categorized findings into Audited Risk Vectors (fully quantified within this report) and Excluded Variables (identified as financial leaks but omitted due to API-level reporting constraints).
1. Audited Quantifiable Capital Leaks
The core optimization dataset was generated by cross-referencing user provisioning status against Microsoft 365 interactive sign-in logs. The audit calculated waste based strictly on three binary, non-negotiable vectors:
- Licensed but Disabled Identities: User accounts within the Entra ID ecosystem that have been explicitly disabled or blocked from sign-in by administration, yet maintain an active, revenue-generating license assignment.
- Dormant License Assignments (30+ Days Inactive): Accounts that remain enabled in the directory but have registered zero interactive user sign-ins across any associated endpoint or web application for a period exceeding 30 consecutive days.
- Unassigned Inventory (Shelfware): Active subscriptions purchased directly from Microsoft or through a Cloud Solution Provider (CSP) that sit unallocated in the billing console inventory pool, delivering zero concurrent utility.
2. Technical Exclusions and Systemic Scope Limitations
To prevent false positives and maintain conservative cost-recovery estimates, two common areas of significant overspend were excluded from the final quantitative percentages due to platform and API limitations:
The Tier Over-Licensing Boundary (Gitbit Data Constraints)
While data from Gitbit effectively aggregates and maps user-level metadata for core, high-volume productivity applications (such as Exchange, Teams, and the primary Office suite), native reporting constraints limit comprehensive feature visibility. Advanced compliance, security, and governance deployments, such as active Data Loss Prevention (DLP) policies, Microsoft Purview information protection, Entra ID P2 identity protection, or Intune device compliance schemas, operate outside the standard app-usage metadata streams pulled by Gitbit.
Because down-tiering an account based solely on core app inactivity could inadvertently break a user's critical compliance or DLP configuration, all potential over-licensing and tier-downgrade opportunities were entirely excluded from our final 22% waste metric. The 22% figure consists solely of complete, absolute license underutilization (shelfware, disabled accounts, and dormant users).
The Contractual Term Opacity Layer
A separate, highly prevalent vector of M365 overspend stems from poor procurement alignment regarding license terms, specifically, maintaining dynamic workforces on high-premium monthly commitment terms rather than locked-in annual or multi-year agreements.
Because Microsoft does not provide license term data within any administrative APIs, it is technically impossible to automate the calculation of commitment-term premiums. Consequently, this contract-level inefficiency was also omitted from the final data models.
Methodological Takeaway: By eliminating tier over-licensing and contract-term variations from the data, the documented 22% waste figure represents a strictly conservative baseline. The true total optimization margin, including compliance right-sizing and commitment re-alignment, is highly likely to exceed this number upon manual deep-dive verification.
The Real Cost of SaaS Spend Waste in Enterprise IT
As modern enterprise IT infrastructure completely decentralizes, Software-as-a-Service (SaaS) applications have evolved from secondary operational tools into core structural line items. According to global technology spend indicators compiled by Gartner, worldwide software expenditure has reached an unprecedented scale, projected to surpass $1.44 trillion. This rapid expansion is heavily concentrated in productivity platforms, database suites, and AI-driven workflow software. - Gartner
However, this aggressive expansion has severely outpaced corporate internal governance mechanisms. Because SaaS licensing operates on an agile, per-user, per-month procurement framework, organizations frequently fail to track the real-time utilization of their contracted seat inventory. The result is a compounding layer of capital inefficiency that quietly penalizes corporate operating margins.
The Operational Mechanics of SaaS Waste
Historically, public cloud infrastructure cost management focused strictly on Infrastructure-as-a-Service (IaaS) metrics, optimizing compute runtimes, right-sizing virtual machine processing cores, and eliminating unattached block storage volumes. The broader industry baseline for public cloud waste sits at a high 29%. - Codelynks & Devinity Solutions
SaaS environment waste, however, operates under entirely different financial dynamics, demanding an independent framework for analysis:
- Linear Recurring Friction: Unlike IaaS instances, which can be dynamically scaled down or automatically scheduled for off-hours shutdown to curb costs, SaaS seat licenses are rigid. Once provisioned, a license incurs a full monthly capital charge regardless of whether the user interacts with the application for forty hours a week or zero hours a month.
- Decentralized Lifecycle Disconnects: SaaS waste is rarely an engineering design flaw; it is an administrative execution gap. The disconnect typically exists between Human Resources onboarding/offboarding workflows and automated IT identity provisioning loops.
- The "Low-Sticker" Illusion: Because single-user SaaS license fees appear modest in isolation, individual departments frequently circumvent centralized procurement to spin up isolated software environments. Cumulatively, these unmonitored pools create "shelfware", paid licenses that remain entirely unallocated.
Expanding the Scope of Technology Value Management (FinOps)
This shifting reality has driven a foundational transformation in cloud cost engineering. Data from the FinOps Foundation highlights that the discipline has definitively expanded beyond public cloud infrastructure; today, 90% of dedicated cost-optimization teams are actively tasked with managing SaaS and licensing profiles.
The industry’s core operational focus has transitioned from a historical strategy of reactive bill review to a modern strategy of proactive unit economics. In an environment where software costs directly impact gross margins, identifying and reclaiming lost license capacity is no longer a minor housekeeping task. It is a critical fiduciary requirement.
Our audit of the Microsoft 365 tenant environment applies this precise analytical framework, isolating quantifiable vectors of asset underutilization to protect corporate capital from systemic leakage.
Identifying the 22% Efficiency Gap in Microsoft 365 Cloud Spend
To establish a definitive, empirical assessment of our software expenditure, a comprehensive internal audit was launched to evaluate user utility metrics across the corporate Microsoft 365 (M365) tenant. Rather than viewing the monthly Microsoft invoice as an unalterable operational expense, this analysis treated M365 as an active cloud resource deployment subject to strict efficiency metrics.
The baseline scope of this investigation targeted the alignment between capital allocation, the licenses actively purchased and assigned, and concrete user interaction logs. The resulting data exposes a profound disconnect between procurement models and actual workplace demand.
Defining the 22% Waste Baseline
The primary conclusion of this tenant analysis is a clear, quantifiable operational baseline: 22% of total Microsoft 365 expenditure represents clear cloud spend waste.
Methodological Boundary Reminder: To ensure the absolute integrity of this audit for leadership review, this 22% figure is explicitly conservative. It completely excludes any speculative savings from tier over-licensing (such as E5 down-tiering to E3) or contract-term optimizations. The 22% represents absolute, non-utilized capital leakage.
When mapped against broader enterprise technology trends, a 22% waste margin positions our M365 environment slightly below the standard 29% waste average seen in public infrastructure cloud compute (IaaS). However, because SaaS spending directly correlates to fixed per-seat headcount rather than dynamic computing workloads, this 22% inefficiency indicates a systemic breakdown in continuous identity lifecycle management rather than erratic usage spikes.
Macro Financial Implications
In an enterprise architecture, a 22% financial drag on a core utility platform has a compounding negative impact on the broader IT operating budget. Software spend waste operates as an unindexed tax on operational capital, offering zero return on investment while consuming funds that could otherwise drive strategic IT modernization initiatives.
This efficiency gap is driven primarily by the lag time inherent in manual or fragmented provisioning systems. When an organization scales or experiences normal workforce turnover, licensing adjustments rarely happen in real time. The resulting baseline data demonstrates that without continuous programmatic oversight, the M365 tenant naturally drifts toward a state of systemic over-provisioning.
The following sections of this report will deconstruct the precise operational vectors where this 22% capital leak occurs, outlining the structural vulnerabilities that allowed these resources to remain funded yet completely dormant.
Microsoft 365 License Optimization: Where the Budget Leaks
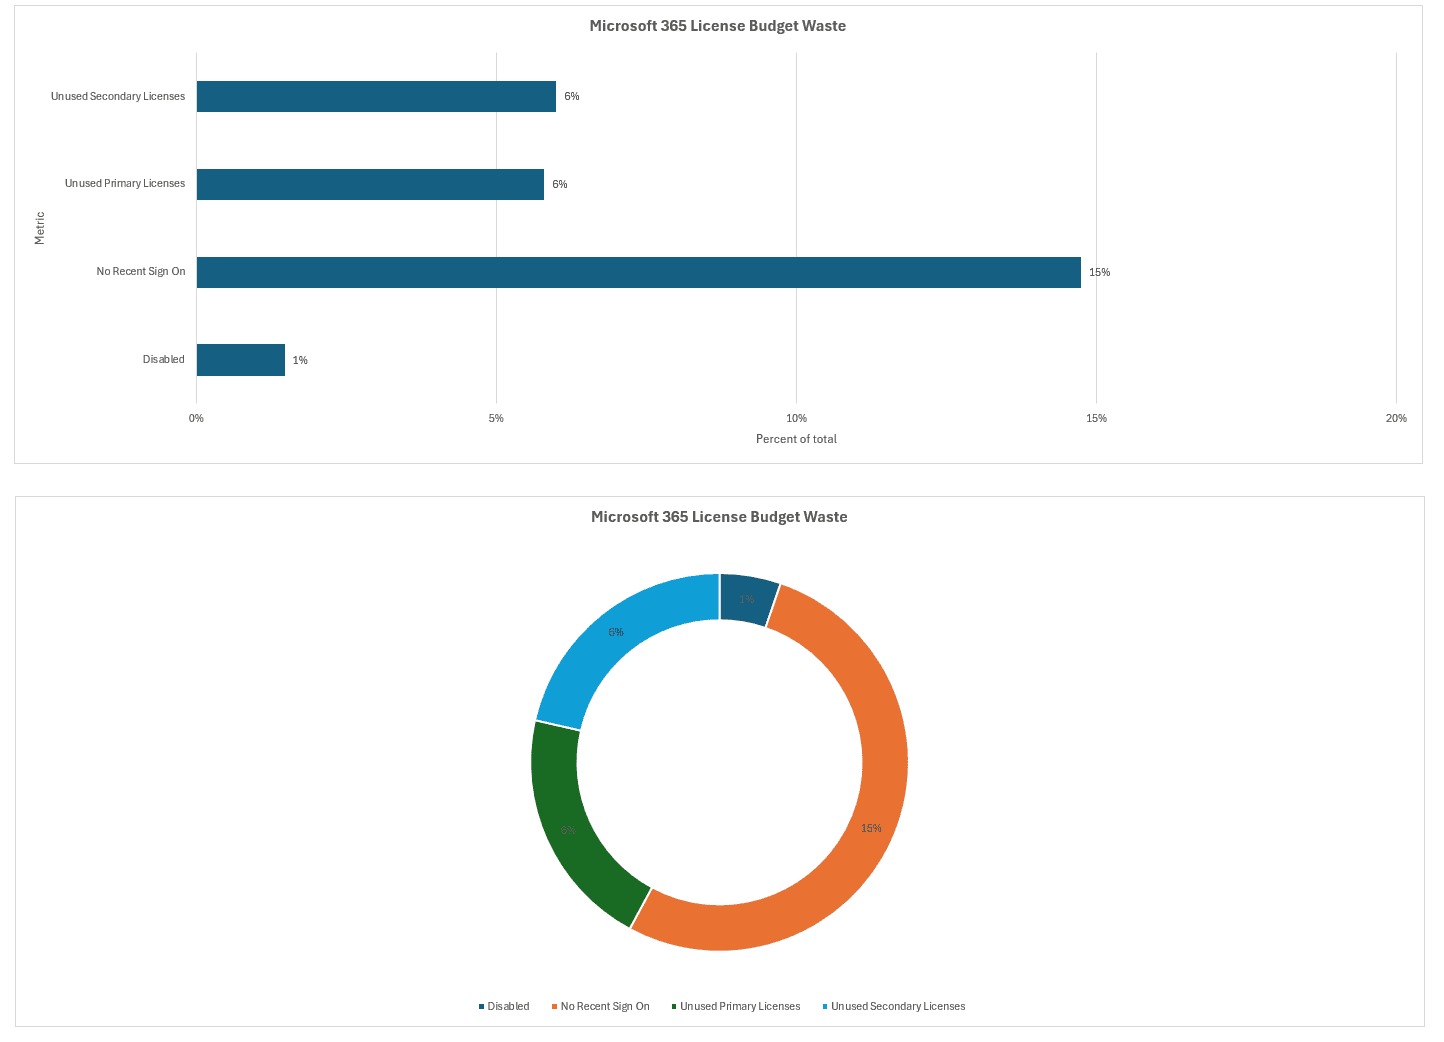
To execute an effective cost-recovery strategy, the 22% aggregate waste baseline must be separated into its distinct operational components. Rather than representing a uniform oversight, our audit reveals that this capital leakage is distributed across three distinct vectors of administrative drift.
Each vector represents a different stage of identity and asset management failure, ranging from offboarding protocol delays to over-procurement of unallocated software inventory.
Dormant License Assignments: The 14.7% Inactivity Drag
The single largest contributor to tenant waste, accounting for 14.7% of total M365 expenditure, stems from accounts that remain fully enabled and licensed but have registered zero interactive sign-ins across any application or endpoint for 30 consecutive days or more.
- Operational Mechanism: These accounts represent active identities in the Entra ID ecosystem that consume high-value seat allocations (such as Microsoft 365 E3 or Business Premium) while providing zero measurable productivity return.
- Root Cause Analysis: This continuous leakage is typically driven by extended leaves of absence, project reassignments, contractor roll-offs, or fragmented internal identity monitoring. Without automated policy enforcement that flags inactivity at the 30-day threshold, these subscriptions sit funded in perpetuity.
Unassigned Primary Inventory (Shelfware): The 5.83% Buffer Leak
Unallocated primary subscription capacity sitting idle in the tenant administration console accounts for 5.83% of total M365 capital waste.
- Operational Mechanism: Unlike assigned licenses that suffer from account dormancy, these are core, high-tier licenses (including Microsoft 365 E3 and Microsoft 365 Business Premium) that have been purchased directly from Microsoft or through a Cloud Solution Provider (CSP) but hold a status of
Unassigned. - Root Cause Analysis: This shelfware accumulates when procurement teams purchase license blocks to secure bulk tier pricing or to maintain a "headcount buffer" for anticipated onboarding. When hiring paces slow or buffer management remains manual, these paid primary seats act as pure idle capital.
Extended Finding: The Unassigned Add-On Vector (+6.0%)
Beyond the core 22% primary license waste metric, our audit isolated an additional layer of unallocated inventory within supplementary services. Unassigned standalone add-on licenses such as Microsoft Entra ID P1/P2, Microsoft Defender for Endpoint, and specialized security add-ons account for an extra 6.0% of unassigned license volume.
While add-on licenses carry lower per-unit sticker prices than full enterprise suites, their cumulative leakage represents significant unallocated security capital that delivers zero protection to the environment.
Licensed but Disabled Identities: The 1.5% Offboarding Disconnect
While representing the smallest individual proportion at 1.5% of total spend, the presence of active licenses attached to explicitly disabled user accounts represents the most easily preventable form of financial waste.
- Operational Mechanism: Accounts in this category have been marked as disabled or blocked from sign-in by tenant administrators, typically during an initial HR termination event, yet their associated M365 subscription remains active and billing.
- Root Cause Analysis: This leak exposes a procedural gap between identity access management (blocking authentication) and license lifecycle management (harvesting or de-provisioning the license). Disabling an identity stops access, but without a dedicated second-step automated workflow to remove or convert the license (e.g., transitioning to a free shared mailbox for data retention), monthly recurring billing continues indefinitely.
Managing Inactive Accounts and Orphaned M365 Licenses
Reclaiming misallocated capital within Microsoft 365 requires a clear operational framework that balances cost optimization with data retention and business continuity. Because user identities fluctuate constantly through hiring, offboarding, and temporary leaves of absence, managing inactive and orphaned licenses cannot be executed as a blunt, automated bulk deletion.
To address the 1.5% disabled-license leakage and the 14.7% dormant-license leakage identified in our tenant audit, the organization relies on two distinct, structured governance workflows: a multi-step offboarding pipeline and a consultative dormancy review protocol.
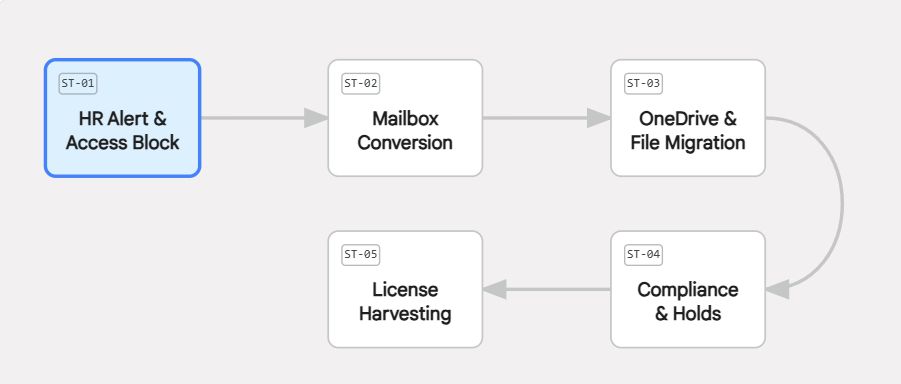
The Standard Offboarding Pipeline (Preventing Orphaned Licenses)
When an employee leaves the organization, revoking access credentials without immediately deprovisioning the associated paid subscription creates an "orphaned license", an active monthly cost associated with a disabled identity.
To eliminate this gap, the IT offboarding workflow enforces a strict sequential pipeline that preserves all corporate data while systematically harvesting the paid license:
- HR Notification: HR initiates the offboarding request.
- Credential Revocation: IT immediately disables the account within Entra ID, revoking active session tokens and blocking authentication.
- Mailbox Conversion (Data Preservation): Rather than deleting the user mailbox or maintaining a paid license solely for archival access, IT converts the primary mailbox into a Microsoft 365 Shared Mailbox (free up to 50 GB).
- Access Delegation: Full mailbox permissions are explicitly delegated to either the incoming replacement team member or the former employee’s direct supervisor for business continuity.
- OneDrive Content Migration: All personal OneDrive for Business documents, site assets, and project files are extracted and migrated directly to a designated SharePoint Online document library, the replacement user’s OneDrive, or an archived local server share.
- Retention Policy Alignment: Automated Microsoft Purview retention policies remain active across the underlying identity to satisfy statutory compliance, eDiscovery, and legal hold obligations.
- Final License Harvest: Once data conversion, delegation, and migration are verified, IT unassigns the Microsoft 365 license from the disabled account, returning the subscription to the available inventory pool or cancelling the unneeded seat.
Key Operational Takeaway: Under this workflow, zero historical user data is lost when a license is reclaimed. Converting to shared mailboxes and migrating OneDrive content ensures 100% data preservation at zero ongoing software licensing cost.
Consultative Dormancy Protocol (Managing the 30-Day Window)
While offboarding handles departed personnel, the 14.7% dormant license margin represents accounts that remain fully enabled but have registered zero interactive sign-ins for 30 consecutive days.
Because dormancy can be driven by valid operational scenarios, such as medical leave, parental leave, temporary sabbaticals, or internal process oversights, IT does not enforce a rigid, automated license deletion at day 30. Instead, a consultative review threshold is triggered:
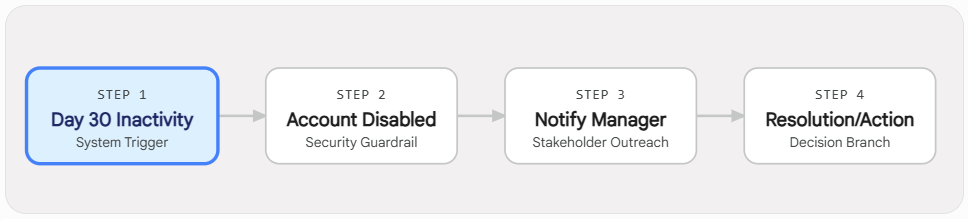
- Step 1: Automated Detection: The system flags any user account registering 30 consecutive days without an interactive sign-in across Microsoft 365 services.
- Step 2: Protective Disable: IT temporarily disables authentication on the dormant account to secure the endpoint and halt potential unmonitored access.
- Step 3: Stakeholder Consultation: IT automatically dispatches a notification to the user and their direct manager to confirm the account status and identify the root cause (e.g., extended sick leave, project pause, or unnotified termination).
- Step 4: Resolution & Right-Sizing:
- If Extended Leave: The license is temporarily unassigned or down-tiered while the account remains protected until the employee's return date.
- If Process Oversight / Departure: The account is routed directly into the Standard Offboarding Pipeline above to preserve data and permanently harvest the license.
Enterprise E5 vs. E3: Solving the Over-Licensing Problem
While absolute license underutilization (shelfware and dormant accounts) forms our core 22% waste baseline, our tenant audit isolated a secondary, highly prevalent optimization horizon: systemic primary license stacking.
In a fully optimized environment, total primary suite assignments across a workforce should never exceed 100% of active headcount. However, cross-referencing assignment tables across our user base revealed a 125% total primary license coverage rate.
| License Tier | Share of User Base | Monthly List Price (Annual Term) |
| Office 365 E3 | 33% | $23.00 / user / mo |
| Microsoft 365 F1 | 24% | $2.25 / user / mo |
| Microsoft 365 E3 | 22% | $39.00 / user / mo |
| Microsoft 365 E5 | 22% | $60.00 / user / mo |
| Microsoft 365 F3 | 14% | $8.00 / user / mo |
| Microsoft 365 Business Premium | 5% | $22.00 / user / mo |
| Microsoft 365 Business Premium (no Teams) | 2% | $19.75 / user / mo |
| Microsoft 365 Business Standard | 1% | $12.50 / user / mo |
| Microsoft 365 Business Standard (no Teams) | 1% | $10.25 / user / mo |
| Total Primary Assignment Rate | 125% | Over-Provisioned Baseline |
At minimum, 25% of the workforce carries overlapping primary licenses, such as a user simultaneously holding both an Office 365 E3 and a Microsoft 365 Enterprise or Frontline suite. This double-assignment occurs when automated group-based licensing overlaps with legacy manual seat assignments during role changes or departmental shifts.
Another common scenario occurs when a user is initially assigned a lower-tier license, then needs expanded capacity and is assigned a high-tier license, without removing the lower-tier license. For example, a user is initially assigned a Microsoft 365 F3 license, their mailbox grows beyond the 2GB limit, and is assigned a Microsoft 365 Business Premium without removing the Microsoft 365 F3 license.
Deconstructing the E5 Over-Licensing Premium
Beyond license stacking, the distribution shows that 22% of the entire user base is assigned top-tier Microsoft 365 E5 subscriptions ($60/user/month).
In enterprise environments, M365 E5 is primarily deployed to acquire Microsoft's advanced security capabilities (such as automated incident response, identity protection, and endpoint detection). However, for organizations that require top-tier security compliance but do not fully utilize E5’s telephony (Teams Phone) or advanced business intelligence (Power BI Pro) components, assigning full E5 suites creates a persistent structural overspend.
The Component Unbundling Alternative
A direct cost comparison highlights the financial leverage of targeted unbundling:
- Microsoft 365 E5 (Full Suite): $60.00/user/month
- Microsoft 365 E3 ($39) + Defender Suite ($12): $51.00/user/month
- Net Realizable Savings: $9.00/user/month (15% reduction per seat)
Transitioning security-focused users from full M365 E5 to a M365 E3 + Microsoft Defender Suite (formerly M365 E5 Security) bundle maintains the complete advanced security posture while stripping out unused enterprise add-ons, instantly reducing per-user licensing costs by 15%.
The Methodological Safety Boundary: Why Tier Downgrades Require Audit Validation
As established in our auditing methodology, potential savings from E5-to-E3 down-tiering or unstacking were deliberately excluded from our primary 22% waste metric.
Because Gitbit and native reporting APIs pull user metadata for core productivity applications (Exchange, Teams, Office apps) but do not fully expose underlying governance configurations, such as active Data Loss Prevention (DLP) policies, Microsoft Purview information protection tags, or Entra ID P2 conditional access rules, executing automated bulk downgrades introduces operational risk.
Governance Guardrail: Down-tiering an account based solely on core app inactivity risks silently disabling a user’s DLP or compliance policy. Right-sizing the 22% E5 tier and resolving the 125% license stacking anomaly requires a manual, phased security validation before removing or altering active subscription tiers.
Eliminating Unassigned License Inventory (Shelfware)
Unassigned license inventory, commonly referred to as "shelfware", represents fully paid subscription capacity that sits unallocated in the Microsoft 365 admin console, delivering zero operational value.
While total unassigned inventory across our tenant reaches 5.9%, our audit isolates this leak into two distinct operational layers:
- 5.8% Primary License Shelfware: High-cost primary enterprise suites, including Microsoft 365 E3, Microsoft 365 E5, and Microsoft Business Premium, sitting idle in the tenant pool.
- 6.0% Add-On License Shelfware: Standalone security and management services, such as Microsoft Entra ID P1/P2, Microsoft Defender for Endpoint, and specialized compliance add-ons, purchased as supplementary seats but remaining unassigned.
Operational Root Causes: Why Shelfware Accumulates
Unassigned inventory is rarely the result of intentional over-procurement; rather, it is the natural byproduct of structural friction between operational administrative tiers and external procurement models.
1. Administrative Role Separation (Tier 1 vs. Tier 2 Friction)
In modern enterprise IT environments, identity lifecycle management is deliberately split across separate operational tiers for governance and security:
- Tier 1 (Help Desk / Provisioning): Tasked with day-to-day user management, assigning and removing active licenses from specific employee accounts based on HR tickets.
- Tier 2 (IT Management / Procurement): Holds global administrative privileges to purchase, add, or cancel license quantities within the tenant or billing portal.
Because Tier 1 help desk staff lack authority to reduce tenant-level license counts when offboarding users, harvested licenses naturally accumulate in the unassigned pool. Without a formal handoff protocol triggering Tier 2 to reduce tenant seat limits, these unassigned seats persist indefinitely.
2. CSP Ecosystem Latency & Procurement Friction
Under Microsoft’s Cloud Solution Provider (CSP) framework, many organizations do not purchase licenses via direct web billing. Instead, license additions and removals must be routed through an external third-party Microsoft Partner (CSP).
Because removing a license requires submitting a manual ticket to an external vendor, IT managers often maintain a surplus license buffer to avoid onboarding delays for new hires. Over time, as hiring projections fluctuate, this manual buffer degrades into persistent, funded shelfware.
Strategic Objective: Rethinking Procurement Toward a Zero-Buffer Model
In an optimized Microsoft 365 environment, the target unassigned license buffer should ideally be 0%.
To eliminate the holding costs of surplus shelfware, organizations must modernize how license purchasing and lifecycle management are executed.
The Monthly Re-Calibration Protocol
For organizations operating within CSP agreements or delegated Tier 1/Tier 2 structures where a real-time zero-buffer model is constrained by vendor turnaround times, IT leadership must implement a Monthly License Re-Calibration Protocol:
- 30-Day Headcount Alignment: On a fixed monthly billing cadence, Tier 2 procurement reviews known HR hiring and offboarding projections for the upcoming 30 days.
- Right-Sizing Vendor Seat Counts: The IT Manager issues a monthly true-down request to their Microsoft CSP Partner, adjusting total tenant subscription counts to match projected active headcount plus known immediate starts.
- Automated Buffer Monitoring: Implementing automated alerting within the admin portal that flags any primary or add-on license category where unassigned inventory exceeds 1% of active seat count for more than 14 consecutive days.
By transitioning from static, unmanaged buffer pools to a monthly dynamic re-calibration framework, the organization can systematically recover this 5.9% combined primary and add-on shelfware margin, converting idle holding costs back into usable IT operating capital.
Security and Governance Risks of Unmanaged Cloud Tenants
In enterprise IT architectures, financial cost management and cybersecurity posture are deeply intertwined. An unmanaged, underutilized Microsoft 365 license is rarely an invisible accounting error; it is an unmonitored entry point into the corporate directory.
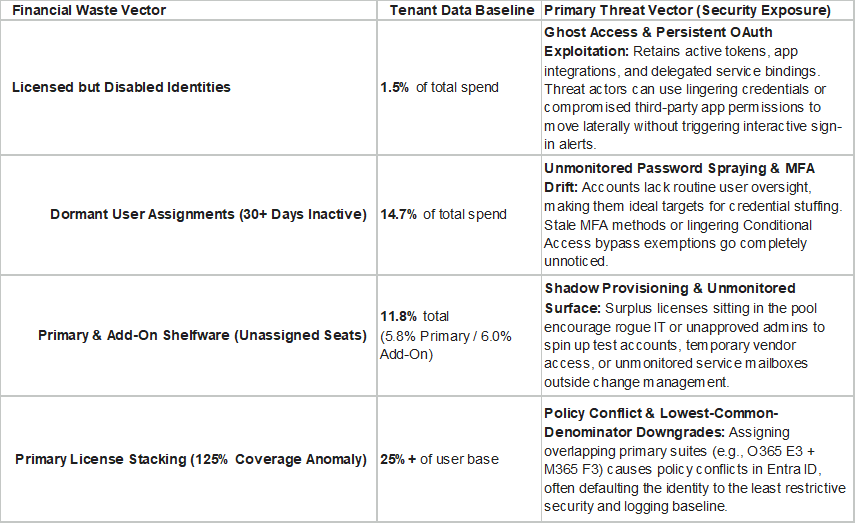
When an organization permits 14.7% of its workforce identities to sit dormant or allows 1.5% of its disabled user accounts to retain active licenses, it expands its digital attack surface. Unmanaged license allocations directly weaken tenant posture, degrade identity governance, and introduce critical exposure vectors across modern cloud security frameworks.
1. The Threat Vectors of Dormant & Orphaned Identities
Credential Stuffing and Password Spraying Vectors
Accounts that register no interactive sign-in activity for 30 consecutive days (the 14.7% dormant margin) are high-value targets for external threat actors. Because these accounts lack routine user oversight, unauthorized access attempts, such as targeted password spraying or credential stuffing via compromised third-party databases, frequently go undetected. If an attacker successfully compromises a dormant identity, they can establish persistent access within the tenant without raising immediate user flags.
The Privilege Escalation Path
Accounts that remain disabled in Entra ID while retaining active, high-tier licenses, such as Microsoft 365 E5, present an acute privilege escalation risk.
Even when direct interactive sign-in is blocked, lingering licenses often maintain active OAuth application permissions, legacy protocol grants, or delegated service bindings. Attackers leveraging compromised third-party app integrations can exploit these orphaned entitlements to move laterally across SharePoint Online document libraries or Teams channels without triggering standard sign-in alerts.
2. Security Configuration Drift and Policy Blind Spots
Multi-Factor Authentication (MFA) & Conditional Access Stale States
Security architectures rely on dynamic identity signals, such as user risk levels, device compliance state, and trusted location policies enforced via Microsoft Entra ID Conditional Access. Dormant accounts create configuration drift:
- Stale Security Info: Users on extended leave or unmonitored roll-offs often maintain outdated Multi-Factor Authentication (MFA) registration methods (e.g., deprecated SMS verification or lost hardware tokens).
- Exemption Policy Creep: To accommodate temporary workflow issues or legacy software, administrative teams occasionally create conditional access exemption rules. When dormant accounts sit in these exemption groups indefinitely, they become permanent, unmonitored bypass paths into the tenant.
The License Stacking Anomaly (The 125% Coverage Blind Spot)
As identified in our audit data, at least 25% of the user base carries overlapping primary licenses (e.g., holding both an Office 365 E3 and a Microsoft 365 F3 or Business Premium suite simultaneously).
Beyond the financial penalty, license stacking creates severe policy enforcement conflicts. Different license tiers carry distinct native security policies, retention capabilities, and Entra ID protection levels. When a single user identity is assigned conflicting primary suites, automated security engines may fail to apply the stricter security baseline, defaulting to the lowest common denominator and leaving the endpoint exposed.
3. Regulatory and Compliance Impacts
While regulatory mandates vary by industry and region, virtually every major compliance framework explicitly requires strict control over identity lifecycles, data retention, and access management. Leaving 22% of an M365 tenant unmanaged directly violates core tenant controls across major global standards:
| Compliance Framework | Relevant Control Domain | Impact of Unmanaged M365 Tenants |
| SOC 2 (Type II) | CC6.1, CC6.2, CC6.3 (Access Control & Offboarding) | Lingering disabled accounts with active subscriptions flag audit exceptions during user access reviews (UAR). |
| ISO/IEC 27001:2022 | Control A.5.16, A.5.18 (Identity & Access Rights) | Failure to revoke licenses and entitlements systematically upon role termination indicates non-compliant access lifecycle controls. |
| NIST SP 800-53 (Rev. 5) | AC-2 (Account Management), AC-6 (Least Privilege) | Dormant identities (30+ days inactive) violate mandatory account inactivation and least-privilege enforcement mandates. |
| HIPAA Security Rule | 45 CFR § 164.308(a)(3)(ii)(C) (Termination Procedures) | Unmonitored access to mailboxes or OneDrive stores containing Protected Health Information (PHI) exposes the organization to severe breach penalties. |
| GDPR / Privacy Frameworks | Article 5(1)(f) (Integrity and Confidentiality) | Orphaned accounts carrying active licenses increase the likelihood of unauthorized processing or exposure of personal data. |
Executive Security Summary: Eliminating M365 cloud waste is not merely a cost-reduction exercise for the procurement team, it is a fundamental cybersecurity hardening requirement. A fully optimized, zero-shelfware tenant is inherently a more secure, defensible, and compliant enterprise environment.
Step-by-Step Roadmap to Reduce Microsoft 365 Costs
Recovering the 22% baseline waste, resolving the 125% license stacking anomaly, and hardening the tenant security posture requires a coordinated, aggressive execution plan.
This roadmap is designed as a 30-day administrative sprint. It relies on a strict division of labor to prevent operational bottlenecks:
- The IT Manager (Project Driver): Owns the execution, coordinates with external CSP vendors for true-downs, and enforces policy.
- The IT Admins (Data Gatherers): Responsible for pulling reports (via native M365 Admin portals or Gitbit automation) and executing technical configurations.
- Human Resources (Validators): Serves as the ultimate source of truth to validate employment status before any active account is disabled or unassigned.
Timeline
1: Days 1–7: Harvest Shelfware and Disabled Accounts: Targeting the 11.8% Unassigned & 1.5% Disabled Leaks
Objective: Secure immediate capital recovery with zero end-user disruption.
- Action (IT Admins): Export the Active Users and Licenses reports from the Microsoft 365 Admin Center (or use Gitbit's automated report) to isolate all
Unassignedprimary/add-on licenses andSign-in Blockedaccounts retaining active subscriptions. - Action (HR): Validate the list of disabled accounts to confirm termination status.
- Action (IT Admins): Execute the Standard Offboarding Pipeline on validated accounts (convert to Shared Mailbox, migrate OneDrive, harvest the license).
- Action (IT Manager): Contact the CSP Partner to reduce tenant seat limits by the total harvested amount instantly, establishing the new zero-buffer baseline.
2: Days 8–14: Resolve the 125% Primary Stacking Anomaly: Targeting Duplicate Seat Assignments.
Objective: Eliminate overlapping license costs without altering user access to core applications.
- Action (IT Admins): Cross-reference user billing reports to identify identities holding multiple primary suites (e.g., Office 365 E3 stacked with Microsoft 365 Business Premium).
- Action (IT Manager): Determine the correct single primary license for each affected user cohort based on their actual security and productivity requirements.
- Action (IT Admins): Strip the secondary/duplicate licenses from the users.
- Action (IT Manager): Issue a secondary CSP true-down request to remove the newly freed stacked licenses from the monthly bill.
3: Days 15–21: Execute the Consultative Dormancy Protocol: Targeting the 14.7% Inactivity Drag.Objective: Right-size inactive accounts while protecting employees on valid extended leave.
- Action (IT Admins): Pull the Entra ID Sign-in Activity reports (or Gitbit Dormancy alerts) to flag all accounts with zero interactive sign-ins over the last 30 days. Temporarily block sign-in to secure the endpoint.
- Action (HR & IT Admins): Route the list to HR and direct managers to categorize each account: Extended Leave (medical, sabbatical) vs. Unreported Departure / Process Oversight.
- Action (IT Manager): Enforce the resolution. Leave accounts remain disabled but intact; unreported departures are routed through the offboarding data-preservation pipeline and their licenses are harvested.
4: Days 22–30: E5 Unbundling Validation & Process Lockdown: Targeting the 22% E5 Over-Licensing.
Objective: Optimize high-tier security spend and permanently establish the monthly zero-buffer governance model.
- Action (IT Admins): Audit the 22% of the workforce holding $60 M365 E5 licenses. Identify users utilizing the advanced security features but not utilizing Teams Phone/Telephony or Power BI Pro.
- Action (IT Manager): Approve downgrades for this cohort to the optimized M365 E3 + Microsoft Defender Suite ($51/user/mo), realizing a 15% per-seat savings.
- Action (IT Manager): Establish the Monthly Re-Calibration Protocol with HR and the external CSP vendor to ensure future headcounts align exactly with paid tenant seats.
Tooling the Roadmap: Native vs. Automated Execution
Executing this 30-day plan can be approached through two distinct administrative pathways:
- Manual Execution via Native Portals: IT Admins manually export CSV files from the Microsoft 365 Admin Center, Entra ID Sign-in logs, and Exchange admin centers. This requires extensive VLOOKUPs to match disabled status, license assignment, and 30-day inactivity metrics into a single actionable spreadsheet for the IT Manager.
- Automated Execution via Gitbit: Organizations can bypass the manual data-stitching phase by using Gitbit to automatically correlate Entra ID telemetry with billing data. This surfaces the exact lists of disabled users, 30-day dormant accounts, and stacked licenses in a single view, allowing the IT Manager to immediately transition to the HR validation and remediation phases on Day 1.
Conclusion: Driving Continuous Microsoft 365 Spend Management
Optimizing a Microsoft 365 tenant is not a passive accounting exercise; it is an executive mandate that aligns financial stewardship with enterprise risk management. The operational data compiled in this audit demonstrates that SaaS waste is rarely the result of a single catastrophic oversight. Instead, it is the cumulative effect of administrative drift, uncollected offboarding licenses, unmonitored 30-day dormancy, redundant primary seat stacking, and unbundled security tiers.
By addressing these operational friction points, executive leadership can achieve immediate, measurable returns across three core performance vectors:
| Waste Vector | Structural Root Cause | Optimization Outcome |
| 22% Baseline Waste | Unassigned primary/add-on shelfware (11.8%), dormant accounts (14.7%), and disabled identities (1.5%). | Immediate Capital Recovery: Eliminates pure holding costs and recaptures idle budget through systematic offboarding and monthly CSP seat re-calibration. |
| 125% Primary License Stacking | Automated group licensing overlaps with legacy manual seat provisioning during role changes. | Redundancy Elimination: Strips duplicate primary subscriptions, aligning every active user with exactly one appropriate primary tier. |
| E5 Over-Licensing Margin | Full M365 E5 deployment for security needs without utilization of Teams Phone or Power BI Pro. | 15% Per-Seat Cost Reduction: Down-tiers security-focused users from $60/user/mo E5 to the optimized $51/user/mo M365 E3 + Defender Suite bundle. |
Executive Insight: Resolving these three vectors simultaneously closes acute security exposures eliminating ghost access on disabled accounts, hardening dormant identities against password spraying, and removing policy enforcement conflicts across stacked tiers.
Institutionalizing the Governance Triad: People, Process, and Tooling
Executing a single 30-day cleanup sprint delivers an immediate financial win, but without continuous operational controls, administrative drift will restore the baseline waste within 6 to 12 months. Maintaining a zero-shelfware tenant requires embedding a permanent Governance Triad across the organization.
1. People (Clear Cross-Functional Ownership)
Governance fails when ownership is ambiguous. Operational control must be anchored by the IT Manager as the project driver, with direct accountability to the CFO for spend alignment and the CISO for access control. Human Resources must serve as the mandatory validator in the offboarding and dormancy pipeline, ensuring no license is unassigned without verified employment status.
2. Process (The Monthly Re-Calibration Protocol)
Organize procurement around a strict Monthly Re-Calibration Protocol. On a fixed 30-day cadence, Tier 2 procurement must reconcile HR hiring/termination projections against tenant seat counts, issuing mandatory true-down requests to the external Microsoft CSP Partner. This converts static, surplus inventory into a dynamic, zero-buffer supply chain.
3. Tooling (Continuous Automated Visibility)
Manual CSV exports and spreadsheet cross-referencing are insufficient for complex cloud environments. Sustained optimization relies on automated identity governance and SaaS management telemetry (such as Gitbit or native Entra ID lifecycle workflows) to continuously correlate sign-in activity, license entitlement, and security usage. Automated alerting must flag dormant accounts and unassigned seats the moment they cross established policy thresholds.
Executive Call to Action
The path from cost leakage to complete tenant optimization is clear, low-risk, and operationally validated. The findings presented in this report provide the blueprint; execution requires only executive authorization.
We recommend that the CFO and CIO jointly authorize the immediate execution of the 30-Day Cost Recovery Sprint. By empowering the IT Manager to execute the phased roadmap, harvesting shelfware, resolving primary license stacking, enforcing the consultative dormancy protocol, and right-sizing E5 tiers, the organization will permanently reduce Microsoft 365 operating expenditures while establishing a defensible, highly secure cloud identity architecture.